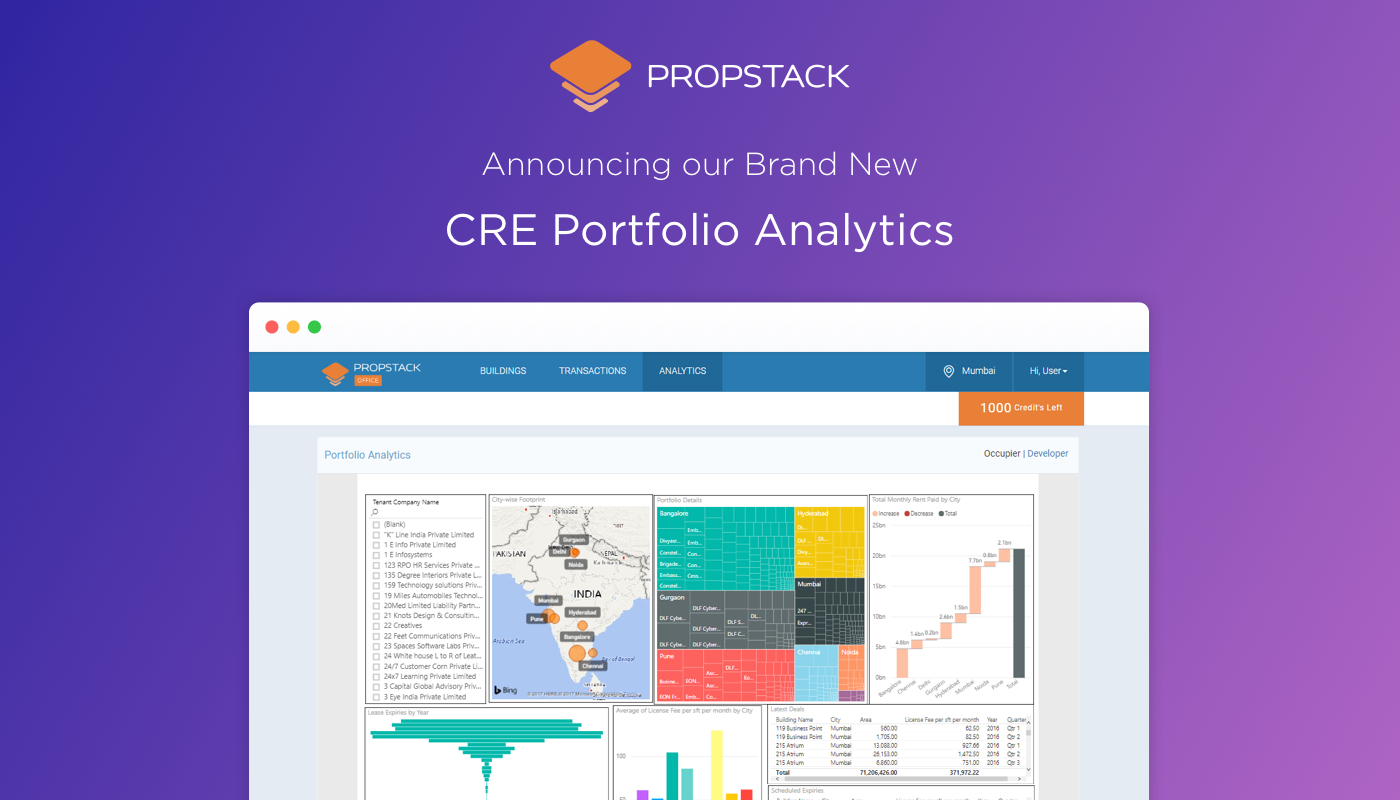
Propstack is excited to launch the industry’s most anticipated and never before seen CRE Analytics dashboard!
The wait is over – with the CRE Portfolio Analytics dashboard.
Propstack users can:
View & Analyze pan-India CRE (by individual occupier) activity in a single window
Square footage across cities and individual properties of active leases, Monthly rental outflow by city, Aggregate schedule of lease expiries by year
View & Analyze pan-India CRE Developer activity in a single window
Portfolio of CRE assets across markets, Square footage by city, Monthly rental income by property!
Analyze your tenant behaviour & preferences
Zero in on individual tenant occupancy portfolios to better understand how a particular tenant/ industry plans its CRE occupancy strategy
Make most informed leasing/ occupancy decisions
Whether you’re a landlord, asset manager or a corporate occupier – make the best CRE decision by understanding markets, commercials and developer strategy in a single view
For more details login to office.propstack.com

